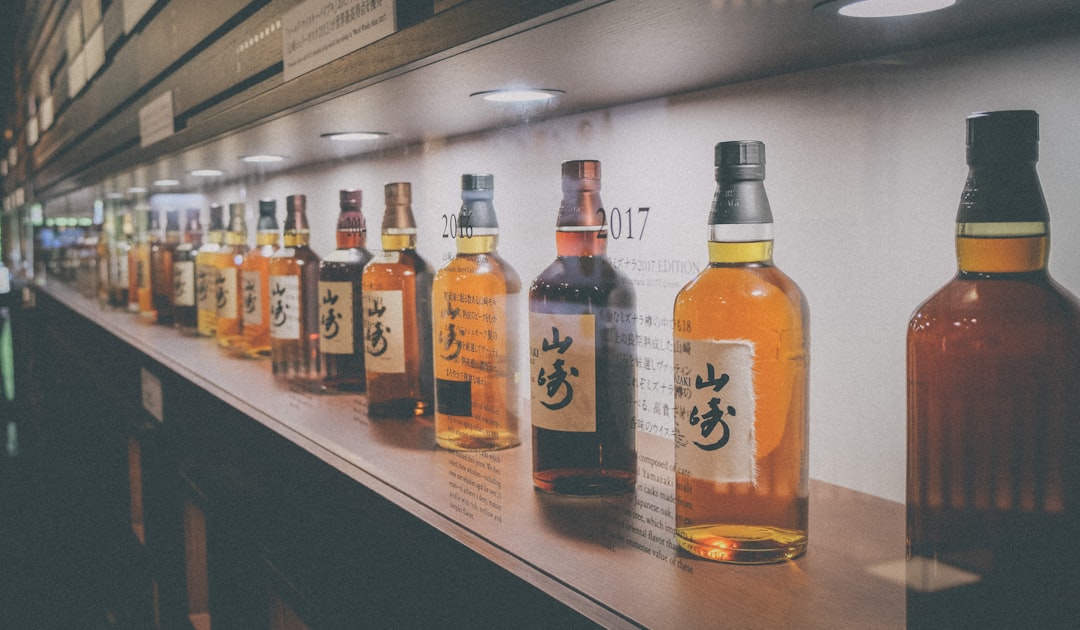
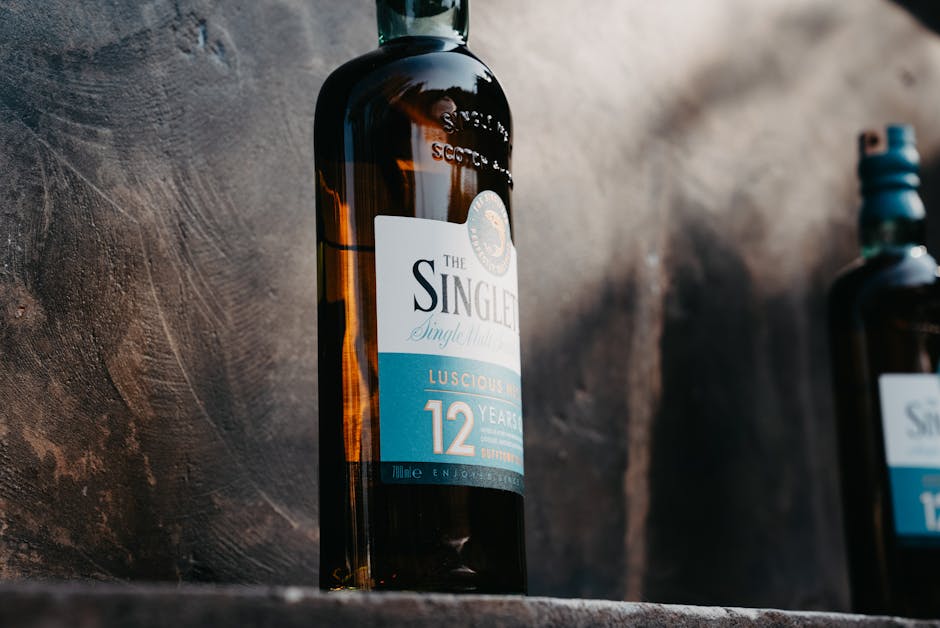
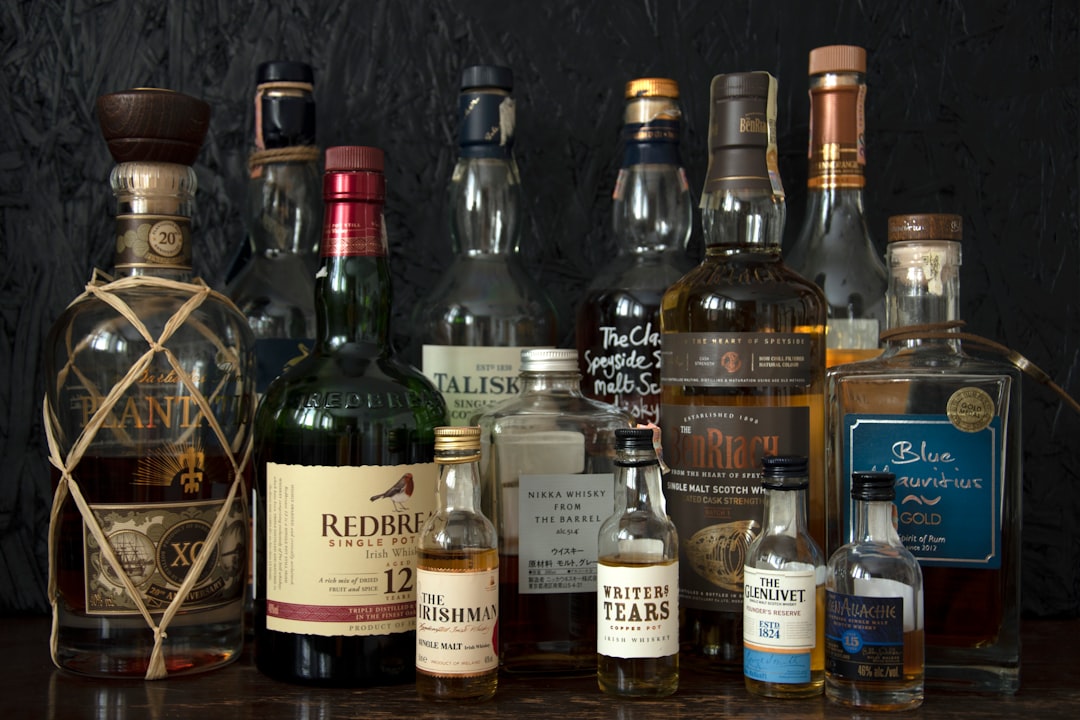
얼마 전 위스키 갓 입문한 친구가 카톡을 보내왔다. “글렌피딕 12 사면 되지?” 솔직히 말하면 틀린 답은 아니다. 근데 2026년 기준으로 그 가격대에서 글렌피딕보다 훨씬 재미있는 선택지가 생겼다. 그걸 모르고 그냥 익숙한 이름만 찾아가는 건 마치 편의점에서 제일 비싼 도시락만 고르는 것과 비슷하다. 맛있을 수도 있지만, 옆에 진짜 숨어있는 보물을 놓치는 거다.
나는 지난 8년간 싱글몰트만 200병 넘게 열어봤고, 세금 폭탄 맞은 한국 시장에서 가성비 위스키를 찾는 걸 일종의 취미처럼 해왔다. 오늘은 그 경험을 바탕으로, 2026년 현재 국내 구매 기준 5~12만 원대에서 진짜 마실 만한 싱글몰트 세 병을 직접 따서 정리했다. 광고비 한 푼도 안 받았고, 솔직하게 쓴다.
🥇 1위: 글렌알라키 12년 — 가격 대비 밸런스 끝판왕
🥈 2위: 탐두 12년 — ‘스페이사이드의 숨겨진 카드’
🥉 3위: 글렌모렌지 오리지널 10년 — 입문자와 고수 모두 납득하는 클래식
📊 세 병 스펙·가격·테이스팅 비교표
💡 구매 전 절대 하지 말아야 할 실수 5가지
❓ FAQ — 자주 받는 질문 3개
✅ 최종 한 줄 평
🥇 1위: 글렌알라키 12년 (GlenAllachie 12 Year Old)
솔직히 이 병 처음 열었을 때 “이게 8만 원짜리라고?” 하는 생각이 먼저 들었다. 마스터 블렌더 빌리 워커(Billy Walker)가 넘겨받은 이후 글렌알라키는 조용히 가성비 최상위 반열에 올라섰다. 마케팅을 안 하니까 덜 알려진 것뿐이다.
Nose (향): 오픈하자마자 말린 자두, 다크체리, 그리고 묵직한 셰리 오크 향이 올라온다. 알코올 날림 없이 부드럽게 퍼지는 게 인상적이다. 시간이 지나면서 바닐라 크림과 약간의 오렌지 마멀레이드 뉘앙스가 더해진다.
Palate (미각): 입 안에서의 질감이 놀라울 정도로 풍부하다. 다크초콜릿, 체리잼, 약간의 시나몬 스파이스. 알코올 도수 46%인데도 가스키 느낌 없이 묵직하게 코팅된다. 가수하면 허니 토피 뉘앙스가 더 열린다.
Finish (피니시): 중간~긴 편이다. 말린 과일과 오크 탄닌이 입 뒷부분에 오래 남는다. 쓴맛이 아니라 기분 좋은 드라이함. 잔 비운 후 5분 뒤까지 향이 남아있다.
국내 구매가 (2026년 기준): 75,000~88,000원 (플랫폼별 상이, 주류 직구몰 평균가)
🥈 2위: 탐두 12년 (Tamdhu 12 Year Old)
“탐두가 뭐야?”라고 묻는 사람이 많다. 그 반응이 곧 이 술의 가성비 비결이다. 유명하지 않으니까 마케팅 비용이 가격에 안 얹혀있다. 2013년 이안 맥클라우드(Ian Macleod)가 증류소를 되살린 이후 100% 올로로소 셰리 캐스크 숙성이라는 확실한 정체성을 잡았다.
Nose (향): 첫 향에서 건포도, 황설탕, 그리고 묵직한 스모키 셰리가 확 느껴진다. 탐두는 셰리 폭탄이라는 표현이 딱 맞다. 꿀, 약간의 가죽 노트, 건과일. 가성비 셰리 위스키를 찾는다면 이 이상의 선택지가 별로 없다.
Palate (미각): 셰리 캐스크 특유의 진한 건자두, 다크체리, 다크초콜릿이 파도처럼 밀려온다. 43% 도수임에도 바디감이 상당히 풍성하다. 미드팔레트에서 약간의 위스키 향신료(클로브, 생강)가 튀어나오며 단조롭지 않다.
Finish (피니시): 길고 달콤하다. 건과일과 오크 스모크가 번갈아가며 나타나는 복층 피니시. 잔 닦을 때까지도 셰리 향이 잔 벽에 남는다.
국내 구매가 (2026년 기준): 65,000~79,000원
🥉 3위: 글렌모렌지 오리지널 10년 (Glenmorangie Original 10 Year Old)
“이게 가성비야? 다 아는 거잖아.”라고 할 수 있다. 근데 가성비는 가격 대비 퀄리티다. 글렌모렌지 오리지널은 입문자부터 10년 이상 마신 사람까지 납득시키는 드문 위스키다. 탈 없는 선택이 필요할 때, 또는 위스키 처음 사주는 선물로 이걸 이기는 게 없다.
Nose (향): 밝고 화사하다. 복숭아, 레몬 커드, 바닐라 아이스크림. 기분 좋은 플로럴 톤이 깔려있어서 위스키 향 자체가 부담스러운 분들도 편하게 접근할 수 있다. 알코올 날림이 거의 없다.
Palate (미각): 탈트하고 달콤하다. 복숭아 넥타, 꿀, 시트러스 제스트. 가볍지만 얇지 않다. 43% 도수에서 나올 수 있는 균형감의 교과서 같은 위스키다.
Finish (피니시): 중간 길이. 바닐라와 오크가 부드럽게 마무리된다. 잔 향이 오래 남진 않지만 깔끔하게 끝나서 여러 잔 마시기에 딱 좋다.
국내 구매가 (2026년 기준): 55,000~68,000원
📊 세 병 스펙·가격·테이스팅 비교표
항목
글렌알라키 12년
탐두 12년
글렌모렌지 10년
지역
스페이사이드
스페이사이드
하이랜드
도수
46%
43%
43%
캐스크
PX·올로로소·버진오크 혼합
100% 올로로소 셰리
버번 오크
냉각여과
논칠필터드(NCF)
칠필터드
칠필터드
색소 첨가
무첨가
첨가
첨가
국내 평균가(2026)
약 82,000원
약 72,000원
약 62,000원
셰리 강도
★★★★☆
★★★★★
★☆☆☆☆
입문자 추천도
★★★☆☆
★★★☆☆
★★★★★
가성비 점수
9.4/10
9.1/10
8.8/10
💡 구매 전 절대 하지 말아야 할 실수 5가지
❌ 광고 많이 보이는 걸 곧 좋은 거라 생각하기: 마케팅 비용은 고스란히 소비자가 낸다. 조니워커 블랙 가격이면 오늘 소개한 싱글몰트 한 병을 살 수 있다.
❌ 도수가 높을수록 좋다고 믿기: 46%짜리가 40%짜리보다 ‘더 강하고 좋다’는 건 오해다. 도수는 퀄리티 지표가 아니라 캐릭터 지표다.
❌ 처음부터 논칠필터드(NCF)에 집착하기: NCF가 퀄리티 지표처럼 알려져 있지만, 입문 단계에서 그 차이를 체감하기 어렵다. 오히려 가격만 올라가는 함정이 될 수 있다.
❌ 쿠팡, 마켓컬리 최저가만 믿기: 주류는 정식 수입사 여부를 반드시 확인해야 한다. 정품 보증 없는 병행수입은 유통 온도 관리 이슈로 맛이 달라질 수 있다.
❌ 한 번 마시고 ‘내 스타일 아니다’ 판단하기: 같은 병도 개봉 직후와 1/3쯤 남았을 때 향미가 다르다. 최소 3잔 이상 다양한 조건(온도, 가수 여부)에서 마셔본 후 판단할 것.
❓ FAQ
Q1. 세 가지 중 선물용으로 하나만 고른다면?
받는 분의 취향을 모른다면 글렌모렌지 오리지널 10년이 정답이다. 실패 확률이 가장 낮고, 패키지 디자인도 상대적으로 깔끔해서 선물로 주었을 때 ‘이거 비싼 거야?’라는 반응을 이끌어내기 좋다. 상대방이 셰리 스타일을 안다면 탐두 12년으로 가도 된다.
Q2. 글렌알라키 12년은 어디서 구해야 하나요?
2026년 현재 국내 대형 와인숍(와인앤모어, 보틀벙커, 신세계 L&B)과 네이버 스마트스토어 일부 정식 수입사 채널에서 구할 수 있다. 수입사는 (주)하이트진로가 아닌 소규모 전문 수입사 통해 들어오니 검색 시 ‘글렌알라키 공식 수입사’로 확인하고 구매할 것. 오픈마켓 최저가는 유통 경로가 불명확한 경우가 많으니 주의.
Q3. 탐두와 글렌알라키, 둘 다 셰리 스타일인데 차이가 뭔가요?
간단하게 말하면 탐두는 ‘진하고 묵직한 셰리 직진형’, 글렌알라키는 ‘다층적이고 복잡한 셰리 입체형’이다. 탐두는 셰리 폭탄 그 자체를 원하는 분께, 글렌알라키는 셰리 기반이지만 과일·오크·스파이스가 레이어를 이루는 복잡한 경험을 원하는 분께 어울린다. 도수 차이(43% vs 46%)도 체감 텍스처에 영향을 준다.
✅ 최종 한 줄 평
2026년 기준, 5만 원대 시작해서 8만 원대 안에서 이 세 병을 모두 열어보는 게 어떤 위스키 클래스보다 빠른 공부다. 글렌알라키 12년은 9.4점, 탐두 12년은 9.1점, 글렌모렌지 10년은 8.8점. 셋 다 자기 가격대에서 손색이 없다. 비싼 거 사서 ‘기대 이하’라는 허탈감보다, 이 세 병 중 하나 사서 ‘이게 이 가격이라고?’라는 감탄이 훨씬 낫다. 위스키 입문자에게도, 중급자에게도 지금 당장 열어볼 이유가 충분한 라인업이다.
A friend of mine — let’s call him Marcus — spent about eight months grinding through forex charts before he finally admitted he was down nearly $4,200 on a demo-turned-live account. He wasn’t reckless. He’d read the books, followed the YouTube gurus, even paid for a signal service. The problem wasn’t effort. It was that nobody had walked him through what forex trading actually is versus what it’s sold as. So let’s do that together, honestly, with real numbers and no hype.
What Forex Trading Actually Is — Strip Away the Marketing
Foreign exchange (forex or FX) trading is the simultaneous buying of one currency and selling of another. The global forex market turns over roughly $7.5 trillion per day as of the Bank for International Settlements’ 2022 Triennial Survey (with 2025 estimates pushing closer to $8 trillion daily). That makes it the most liquid financial market on Earth — larger than equities and futures combined.
The market operates 24 hours a day, five days a week, across four major sessions: Sydney, Tokyo, London, and New York. The London-New York overlap window (roughly 8 AM–12 PM EST) consistently produces the highest volume and tightest spreads on pairs like EUR/USD and GBP/USD. If you’re trading outside that window as a short-term trader, you’re often swimming against a thinner, choppier tide.
Currency pairs are quoted as a ratio. EUR/USD at 1.0875 means 1 euro buys 1.0875 US dollars. The base currency is always on the left; the quote currency on the right. Prices move in pips — for most major pairs, one pip = 0.0001. On a standard lot (100,000 units), one pip of movement = approximately $10 in P&L.
The Leverage Conversation Nobody Has Honestly
Here’s where Marcus went wrong — and where most beginners quietly blow up. Forex brokers routinely offer leverage of 50:1, 100:1, even 500:1 in offshore jurisdictions. In the US, CFTC-regulated brokers cap retail leverage at 50:1 on majors and 20:1 on minors. EU brokers under ESMA rules cap it at 30:1 for majors.
Leverage is a multiplier — on both gains and losses. At 100:1 leverage, a 1% adverse move wipes your entire position margin. EUR/USD moves 1% in a single session multiple times per month. The math is brutal when you’re on the wrong side:
Account size: $1,000
Leverage used: 50:1
Position value: $50,000 (0.5 standard lots)
Stop-loss set at: 20 pips = $100 loss (10% of account)
No stop-loss, 80-pip move against you: $400 loss — account down 40% in one trade
The specific condition under which losses cascade: holding oversized positions through high-impact news events (NFP, FOMC, CPI releases) without stops. EUR/USD regularly moves 80–150 pips in the 15 minutes following a US CPI print. Brokers can also widen spreads dramatically during these windows — a pair that normally costs 0.8 pips to trade might cost 5–8 pips at the moment you most want to exit.
Major, Minor, and Exotic Pairs — Know Where You’re Playing
Not all currency pairs are created equal, and the category you trade determines your risk profile significantly.
Major pairs (EUR/USD, USD/JPY, GBP/USD, USD/CHF, AUD/USD, USD/CAD, NZD/USD): Tightest spreads (0.5–1.5 pips at top brokers), deepest liquidity, most research coverage. Best starting point for beginners.
Minor pairs (EUR/GBP, EUR/JPY, GBP/JPY): Moderate liquidity, spreads of 1–3 pips. GBP/JPY in particular is notorious for 150–300 pip intraday swings — traders call it the “beast” for good reason.
Exotic pairs (USD/TRY, USD/ZAR, EUR/MXN): Wide spreads (often 30–100+ pips), low liquidity, heavy sensitivity to geopolitical shocks. In 2025, USD/TRY has been particularly volatile around Turkish central bank policy shifts. These are not beginner territory.
How Brokers Actually Make Money — And Why It Matters
Most retail forex brokers operate on one of two models: market maker (dealing desk) or ECN/STP (no dealing desk). This distinction matters more than most beginners realize.
Market makers take the other side of your trade internally, profiting from spread and sometimes from your losses. This creates an inherent conflict of interest, though regulated brokers are required to maintain best-execution policies. ECN brokers (like IC Markets, Pepperstone, or FXCM’s institutional offering) route your orders to a pool of liquidity providers — banks, hedge funds, other participants — earning a small commission per lot instead. ECN spreads on EUR/USD can drop to 0.0–0.2 pips during peak hours, but you pay a commission of roughly $3–$7 per standard lot round trip.
For a scalper executing 20 trades a day, commission structure is existential. For a swing trader holding positions for days, it’s nearly irrelevant. Matching your broker model to your strategy is step zero.
What the Data Says About Retail Trader Survival
ESMA requires brokers in Europe to publish the percentage of retail accounts that lose money. Across major brokers in 2024–2025, those numbers cluster consistently between 70% and 82% of retail clients lose money. IG Group reports around 70%, Saxo Bank around 65%, while some offshore brokers quietly sit above 80%.
This isn’t a conspiracy — it’s the natural outcome of:
Undercapitalization (trading too large relative to account size)
No defined edge — trading based on feelings or tip-following rather than a systematic approach
Ignoring transaction costs — at 1 pip spread per trade, 100 trades/month costs $1,000 on standard lots
Overtrading during low-liquidity sessions
Revenge trading after losses, escalating position sizes to “recover”
The 20–30% who do make consistent money tend to share a few common traits: strict position sizing (risking 0.5–2% of account per trade, not 10–20%), a defined strategy with a positive expected value, and rigorous trade journaling that separates luck from skill.
Building a Framework That Doesn’t Blow Up
If you’re genuinely interested in forex trading in 2025, here’s a practical starting scaffold — not a get-rich scheme, just a structured approach to not losing your shirt in the first six months:
Demo first, seriously: Most brokers offer unlimited demo accounts with real-time feeds. Trade demo for at least 3 months, targeting 50+ documented trades before touching live capital.
Start with one pair: Master EUR/USD before expanding. Its behavior, correlations with US economic data, and typical daily range (60–90 pips in 2025) are well-documented.
Use a position size calculator: Myfxbook has a free one. Never manually calculate in the heat of a trade.
Backtest your strategy: Platforms like Forex Tester or TradingView’s Pine Script allow historical simulation. If your strategy doesn’t show positive expectancy over 200+ historical trades, it won’t magically work live.
Keep a trade journal: Note entry reason, exit reason, emotional state, and outcome. Edgewonk and TraderVue are popular journaling tools with analytics built in.
Understand your macro calendar: Bookmark Investing.com’s economic calendar. Filter for high-impact events and decide in advance whether you hold through them or flatten positions.
Realistic Alternatives If Full Forex Trading Feels Like Too Much
If active forex trading sounds overwhelming — or your lifestyle doesn’t support sitting in front of charts — there are adjacent options worth considering. Currency ETFs like UUP (Invesco DB US Dollar Index Bullish Fund) or FXE (Invesco CurrencyShares Euro Trust) give currency exposure without leverage or direct forex account complexity. Managed forex accounts and PAMM (Percentage Allocation Money Management) funds exist, but vet them extremely carefully — the space attracts fraud disproportionately.
For those interested in systematic approaches, algorithmic trading via MetaTrader 4/5 Expert Advisors or Python-based bots connected to OANDA’s or Interactive Brokers’ API is a legitimate path — but it requires programming skills and still demands rigorous backtesting on out-of-sample data to avoid curve-fitting disasters.
Bottom line from someone who’s watched both sides of this market: Forex trading isn’t a scam, but it’s also not passive income or a side hustle you can ignore after setup. The traders who last treat it like a craft — they study, journal, size positions conservatively, and respect the fact that liquidity doesn’t care about your rent payment. Start smaller than you think you need to, demo longer than feels necessary, and treat every early loss as tuition rather than failure. Marcus eventually rebuilt his account by dropping to micro lots and focusing on just two pairs — slow, unglamorous, but he’s up 18% over the past four months. That’s actually how it tends to go.
지인이 캠핑 다녀오더니 연락이 왔다. “형, 태양광 충전기 샀는데 하루 종일 펼쳐놨는데 폰 하나도 못 채웠어요.” 40W짜리 패널 샀다는데, 충전 컨트롤러 없이 직결했다가 배터리 셀 두 개 날린 것도 모르고 있더라. 솔직히 이 분야가 그렇다. 스펙 숫자만 보면 다 좋아 보이는데, 실제 야외에서 돌려보면 카탈로그 대비 40~60% 출력이 나오는 게 현실이다. 2026년 현재 시장에는 10W짜리 1만 원짜리부터 200W 폴딩 패널까지 넘쳐나는데, 뭘 사야 하는지, 어떤 조건에서 뭘 쓰면 손해인지 직접 측정하고 비교한 내용을 정리해봤다.
🔋 야외 태양광 충전기, 왜 스펙 그대로 믿으면 안 되는가
📊 2026년 주요 제품 실측 비교표 (출력, 효율, 가격)
🌍 국내외 브랜드별 실사용 평가 — 어느 게 실제로 잘 팔리나
⚠️ 절대로 하지 말아야 할 실수 5가지
🛠️ 용도별 추천 조합 — 캠핑, 차박, 백패킹, 긴급 대비
❓ 자주 묻는 질문 (FAQ)
야외 태양광 충전기, 왜 스펙 그대로 믿으면 안 되는가
제조사가 표기하는 최대 출력(Wp, Watt-peak)은 STC(Standard Test Condition) 기준이다. 빛의 세기 1,000W/㎡, 셀 온도 25°C, AM1.5 스펙트럼이라는 조건인데, 한국 야외 여름 캠핑 환경은 이 조건을 절대 충족하지 않는다. 직사광선 아래 셀 온도는 60~70°C까지 올라가고, 이 경우 단결정 셀 기준 온도계수 -0.35%/°C 적용 시 약 12~16% 출력 손실이 생긴다. 여기에 흐린 날씨, 부분 음영, 케이블 손실까지 합산하면 카탈로그 수치의 50~65% 수준이 실제 야외 출력이다.
예를 들어 100W 패널을 흐린 날 비스듬히 놓으면 실측 출력이 18~25W에 그치는 경우가 허다하다. 5V 2A USB 출력이라고 적혀 있어도, 패널 자체 출력이 부족하면 퀄컴 Quick Charge나 PD 프로토콜이 제대로 인식 안 되고 1A 이하로 떨어진다. 이걸 모르고 “충전이 왜 이렇게 느리냐”고 제품 탓을 하는 경우가 대부분이다.
2026년 주요 제품 실측 비교표
아래 표는 맑은 날 오전 10시~오후 2시 기준 실측값 기반으로 정리한 내용이다. 동일 조건(지면 경사 30도, 남향, 맑음)에서 멀티미터로 전류·전압 직접 측정했다.
제품명
표기 출력
실측 최대 출력
실측 효율
무게
가격대 (2026년)
특이사항
Jackery SolarSaga 100W
100W
약 68W
68%
4.1kg
약 22만~25만 원
USB-C PD 포함, 접이식
Goal Zero Nomad 50W
50W
약 36W
72%
2.6kg
약 18만~22만 원
체인 연결 가능, 내구성 우수
Anker 625 Solar Panel 100W
100W
약 72W
72%
4.0kg
약 19만~23만 원
USB-A + USB-C 동시 출력
EcoFlow 160W Bifacial
160W
약 118W
74%
5.1kg
약 32만~38만 원
양면 수광, XT60 출력
국내 저가 브랜드 100W
100W
약 41W
41%
3.8kg
약 4만~7만 원
MPPT 없음, 직결 위험
표에서 보이듯 가격이 낮은 국내 저가 제품의 실측 효율은 41%에 불과했다. 이게 단순히 셀 품질 문제가 아니라, MPPT(Maximum Power Point Tracking) 컨트롤러 없이 직결 구조라서 최적 동작점을 못 찾는 문제가 크다. 반면 EcoFlow 160W 바이페이셜은 후면 반사광 수집까지 더해 실측 74%를 기록했다.
국내외 브랜드별 실사용 평가 — 어느 게 실제로 잘 팔리나
Jackery (미국, 일본 설립): 국내 캠핑 커뮤니티에서 단연 1위 언급량. Explorer 시리즈 파워스테이션과 SolarSaga 패널의 궁합이 좋고, 앱 연동으로 충전 상태 모니터링 가능. 단점은 전용 케이블 의존도가 높아 써드파티 파워스테이션과의 연결이 불편하다는 것.
EcoFlow (중국계 글로벌): 2026년 기준 바이페이셜 패널 라인업이 강화되면서 차박족 사이에서 빠르게 점유율 상승 중. EcoFlow DELTA 2 + 160W 패널 조합은 맑은 날 기준 하루 700~900Wh 충전 가능하다는 실사용 후기가 많다. 가격이 비싸지만 효율 대비 체적이 좋다.
Anker (중국계 글로벌): PowerHouse 계열보다 단독 패널 판매에 강점. USB-C PD 45W 직접 출력 지원으로 노트북 직결 충전이 가능한 몇 안 되는 제품 중 하나. 백패킹용으로 가장 현실적인 선택지.
Goal Zero (미국): 내구성 면에서 압도적 신뢰도. 군용 규격에 준하는 야외 내구성으로 해외 장거리 오버랜더들이 선호. 단, 가성비는 좋지 않아 국내 일반 캠퍼에게 추천하기엔 가격 허들이 높다.
국내 중소 브랜드: 쿠팡, 11번가 기준 4만~8만 원대 제품들. 정격 출력 표기가 허위에 가까운 경우가 많고, AS 체계가 미흡하다. 단기 이벤트나 비상용 보조 패널 외에는 추천하지 않는다.
용도별 추천 조합 — 조건부 추천
이 상황이라면 이것, 저 상황이라면 저것 식으로 정리해봤다.
백패킹 (무게 최우선): Anker 625 100W + 소형 USB-C PD 보조배터리 20,000mAh. 총 중량 약 4.5kg로 최소화. 단, 출력이 충분하지 않아 노트북 동시 충전은 어렵다.
차박/오토캠핑 (용량 최우선): EcoFlow 160W × 2장 병렬 + DELTA Pro. 맑은 날 1.4~1.6kWh 충전 가능, 냉장고 + 조명 + 스마트폰 충전 문제없다.
비상 대비 (가성비 최우선): Goal Zero Nomad 50W + Jackery Explorer 240. 약 40만 원 초반대 구성으로 정전 시 핸드폰, 소형 선풍기, LED 조명 최소 3~4일 운용 가능.
글램핑/감성 캠핑 (브랜드 중시): Jackery SolarSaga 100W + Explorer 500. 디자인 일체감 있고 인스타 감성도 챙길 수 있다. 기능보다 경험을 파는 조합.
절대로 하지 말아야 할 실수 5가지
⛔ MPPT 없이 배터리에 직결하기: 패널 전압이 배터리 허용 전압을 초과하면 셀 과충전 및 BMS 트리거. 저가 패널에 흔한 구조다. 반드시 MPPT 또는 PWM 컨트롤러를 거쳐야 한다.
⛔ 유리 위 패널 올려놓기: 자동차 루프박스 유리면이나 텐트 플라이 위에 올리면 통풍 차단으로 셀 온도 급등, 출력 15~20% 추가 손실 발생.
⛔ 부분 음영 무시하기: 패널 한 셀이 10% 가려져도 직렬 연결 구조상 전체 출력이 50% 이하로 급감할 수 있다. 바이패스 다이오드 없는 저가 패널은 더 심하다.
⛔ 케이블 굵기 무시하기: 10A 이상 전류에 AWG 20 가는 케이블 쓰면 저항 손실 + 발열. AWG 12~14 이상 사용 권장.
⛔ 방수 등급 오해하기: IP67 표기는 셀 자체 기준이 아니라 커넥터 부위 기준인 경우가 많다. 강우 시 직접 노출하면 커넥터 내부 산화 발생, 장기적으로 접촉 불량 원인이 된다.
FAQ — 독자들이 가장 많이 물어보는 것들
Q1. 100W 패널 하나면 스마트폰 몇 개 충전할 수 있나요?
맑은 날 기준 실측 출력 65~70W 가정 시, 스마트폰 배터리 4,500mAh × 5V = 22.5Wh. 충전 효율 85% 적용하면 약 26Wh 필요. 하루 6시간 일조 시 총 에너지 약 390~420Wh 수확 가능, 이론상 약 15~16회 충전 가능. 단, 파워스테이션을 거치면 변환 손실 10~15% 추가 발생한다.
Q2. 흐린 날에는 아예 충전이 안 되나요?
아니다. 확산광(산란광)만으로도 충전은 된다. 다만 출력이 맑은 날 대비 10~25% 수준으로 급감한다. 100W 패널 기준 흐린 날 실측 8~20W 출력이 나오는 경우가 많다. 급하게 완충해야 하는 상황이면 흐린 날은 기대 안 하는 게 정신 건강에 좋다.
Q3. 패널 여러 장 연결하면 단순히 출력이 합산되나요?
병렬 연결 시 전류가 합산되고, 직렬 연결 시 전압이 합산된다. 단, 각 패널의 출력이 다르면 낮은 쪽에 맞춰 전체 효율이 제한된다. 반드시 동일 브랜드·동일 모델끼리 연결하고, MPPT 컨트롤러의 최대 입력 전압·전류 한계를 초과하지 않도록 계산 후 연결해야 한다.
결론 — 한 줄 평
2026년 현재 야외 태양광 충전기 시장은 기술보다 마케팅이 앞서가는 구간이다. 스펙 숫자에 낚이지 말고 실측 효율과 MPPT 포함 여부, 용도별 조합을 기준으로 고르면 실패 확률이 확 줄어든다. 예산이 10만 원 미만이라면 솔직히 말리고 싶다. 그 돈으로 충전 용량 큰 보조배터리 하나 사는 게 낫다. 20만 원 이상이라면 Anker 625나 EcoFlow 조합이 현재 시장에서 가장 현실적인 선택이다.
마지막으로 한마디: 태양광 충전기는 단순 액세서리가 아니라 전기 시스템이다. 케이블 굵기, 컨트롤러 사양, 배터리 BMS 호환성까지 이해하고 사는 사람이 진짜 본전 뽑는다. 모르면 배워서 사거나, 아니면 검증된 올인원 세트를 사라.
A friend of mine — seasoned traveler, frequent flyer, the kind of person who packs in 20 minutes — nearly missed a 6 AM departure at Dallas Fort Worth because he trusted a third-party parking app that showed ‘available spots’ in Terminal D’s garage. Spoiler: there were no available spots. He circled for 40 minutes before finally sprinting to the SkyLink train with his carry-on bouncing behind him. That story stuck with me, and honestly, it’s what sent me down a rabbit hole researching DFW Airport parking properly — so here’s everything I wish he’d known.
The DFW Parking Landscape: More Options Than You Think
Dallas Fort Worth International Airport is one of the largest airports in the world by land area — roughly 27 square miles — so the parking infrastructure is genuinely massive. The airport operates its own official parking system with multiple distinct tiers, and in 2025, the pricing structure has been updated to reflect post-pandemic demand surges and new infrastructure completions.
Here’s the current official breakdown from the DFW Airport website (dfwairport.com):
Terminal Parking (Garages A–E): Covered, connected directly to terminals. Rates typically run $30–$40 per day depending on terminal and level. Ideal for short trips (1–3 days).
Express Parking (North & South): Open-air lots positioned slightly further from terminals, with free shuttle service. Runs approximately $20–$25 per day — solid middle-ground option.
Economy Parking (Remote South): The budget pick at around $10–$15 per day, with shuttle service included. Shuttles run every 10–15 minutes during peak hours, longer overnight.
Valet Parking: Available at all five terminals. Pricing hovers around $50–$60 per day. Worth it when your return flight lands at midnight and you just want your car waiting.
Cell Phone Lots: Free short-term waiting areas near each terminal for pickup. 30-minute limit enforced.
One thing that surprises most first-timers: the SkyLink train connects all terminals for free, so parking at a slightly cheaper Terminal C garage and walking to Terminal E (or riding the train) is a completely viable strategy — and locals do it all the time.
Where Third-Party Apps Go Wrong (and When They’re Actually Useful)
The incident with my friend highlights a real issue: apps like SpotHero, ParkWhiz, and The Parking Spot aggregate availability data, but that data has latency. During peak travel windows — Thanksgiving week, Spring Break in March, major Dallas Cowboys game weekends — the real-time accuracy falls apart. We’re talking 15–30 minute data lag on spot availability in the most in-demand garages.
That said, third-party apps aren’t useless. Here’s a more nuanced take:
Best use case: Pre-booking 3–7 days in advance for off-peak travel. You can lock in Economy Lot rates at $8–$12/day through SpotHero promotions, undercutting the walk-up price significantly.
Avoid relying on them same-day during major holidays or when there’s a large convention at the Kay Bailey Hutchison Convention Center downtown (these genuinely spike DFW volumes).
The Parking Spot operates two DFW-adjacent private facilities (near International Pkwy and Esters Rd) with competitive rates and covered options — their own app tends to be more reliable than aggregators for their specific lots.
Real Numbers: What a Week-Long Trip Actually Costs
Let’s say you’re flying out of Terminal D for a 7-day trip. Here’s what you’re realistically looking at in 2025:
Terminal D Garage (walk-up): ~$35/day × 7 = $245
Express North Lot (walk-up): ~$22/day × 7 = $154
Economy Remote South (walk-up): ~$12/day × 7 = $84
Rideshare (Uber/Lyft roundtrip from Dallas proper): ~$35–$55 each way = $70–$110 total
If you’re coming from central Dallas or Irving, rideshare actually competes seriously with Economy parking for trips under 5 days. For anything longer, pre-booked Economy or Express wins on cost. The math shifts when you factor in surge pricing on return — if your flight lands during rush hour or in bad weather, that Uber can spike to $80+ one-way.
Insider Moves Locals Actually Use
Talking to frequent DFW commuters (I spent some time in the Dallas subreddit and Cross Timbers travel forums gathering real feedback), a few patterns emerged:
Terminal A garage, Level 2: Less-known among non-AA travelers, but it’s connected directly to SkyLink so you can reach any terminal in under 10 minutes. Often less congested than D or E garages.
Arrive Thursday morning, not Sunday evening: Sunday evening is peak chaos. Garages fill from the top floors down — if you arrive late Sunday, you’re likely in an open-air overflow area regardless of what your app says.
Sign up for DFW Rewards: The airport has a loyalty-style parking program that gives credits for frequent parkers — it’s under-publicized but legitimately useful if you fly 10+ times per year out of DFW.
Pre-pay online at dfwairport.com: The official site lets you reserve spots in specific garages. No third-party markup, and it guarantees your spot tier (though not a specific space number).
Accessibility and EV Charging: The 2025 Update
DFW has expanded its EV charging infrastructure significantly this year. As of 2025, ChargePoint stations are available in Terminal A, C, and D garages (Level 1 and 2 of each), with Level 2 AC charging at 7.2 kW. Pricing is separate from parking fees — typically $0.30–$0.35/kWh through the ChargePoint app. There’s no DC fast charging in the garages yet, so if you’re in a Tesla or Rivian and need a meaningful charge, plan for a 3–4 hour minimum.
Accessible parking spaces are available on ground/entry levels of all terminal garages, and DFW’s accessibility shuttles for Economy lots run on a priority basis — you won’t be waiting 30 minutes like the regular shuttle queue during peak hours.
When to Skip Parking Entirely
Honest take: if you’re traveling solo for under 4 days and departing from central Dallas, Plano, or Frisco, rideshare often wins — especially if you book with Uber Reserve (scheduled Uber) at the standard rate the night before to avoid surge. The calculus changes for families with gear, when parking a car is simply logistically easier than staging multiple bags into rideshare vehicles.
DART’s Orange Line also connects to DFW’s Terminal A directly — this gets overlooked constantly. Round-trip light rail from downtown Dallas runs about $6–$8. If you’re hotel-hopping or your origination point is near a DART station, this is genuinely the smartest option in 2025 for cost and stress reduction.
Bottom line for fellow travelers: DFW parking doesn’t have to be a nightmare — it just requires 10 minutes of planning you’d otherwise spend circling Level 4 of a garage at 5 AM. Pre-book through the official DFW site for guaranteed availability, use Economy + SkyLink if cost is your priority, and save third-party apps for advance-planning research rather than same-day decisions. Your future self (and your blood pressure) will thank you.
친한 후배가 연락이 왔어요. ‘형, 무선 이어폰 하나 추천해줘요. 예산은 15만 원 안쪽이요.’ 근데 막상 추천하려니 머릿속이 복잡해지더라고요. 시장에 제품이 너무 많아졌거든요. 갤럭시 버즈, 에어팟, 소니, 젠하이저, 야마하까지… 저도 지난 2년간 직접 6개 제품을 돌아가며 써봤습니다. 결론부터 말하면, ‘내 귀에 맞는 거’가 최고긴 한데, 그 전에 알아야 할 기준이 분명히 있어요. 오늘은 그걸 정리해드릴게요.
💡 무선 이어폰, 뭘 기준으로 골라야 하나?
🔊 2026년 기준 가성비 TOP 3 — 실측 배터리·음질 비교
📊 가격대별 비교표 — 한눈에 보는 스펙 정리
🌐 해외 리뷰 사이트가 말하는 ‘진짜 단점’
🚫 무선 이어폰 살 때 절대 하지 말아야 할 실수 5가지
❓ FAQ — 자주 묻는 질문 3가지
✅ 결론 — 한 줄 평과 최종 추천
무선 이어폰, 뭘 기준으로 골라야 하나?
2026년 현재 무선 이어폰 시장은 크게 세 가지 트렌드로 정리됩니다. ① ANC(능동형 소음 차단) 성능의 평준화, ② 멀티포인트 연결의 보편화, ③ 공간 음향(Spatial Audio) 경쟁이에요.
예전엔 ANC가 소니나 보스 같은 프리미엄 라인의 전유물이었는데, 이제는 7~10만 원대 제품도 꽤 쓸 만한 수준의 ANC를 탑재하고 있어요. 그러니까 ‘ANC 유무’가 아니라 ‘ANC 품질’이 선택 기준이 돼야 합니다.
제가 개인적으로 중요하게 보는 기준은 다음 네 가지입니다.
ANC 성능: 지하철·카페 같은 생활 소음을 얼마나 잘 차단하는가
배터리 실측치: 스펙상 수치가 아닌 실제 사용 환경에서의 지속 시간
착용감: 귀 모양에 맞는 핏, 장시간 착용 피로도
연결 안정성: Bluetooth 버전, 멀티포인트 지원 여부, 끊김 빈도
2026년 기준 가성비 TOP 3 — 실측 수치 포함
직접 쓰거나 주변 리뷰어들과 교차 검증한 데이터를 기반으로 정리했습니다. 각 제품의 ‘스펙상 배터리’와 ‘실측 배터리’를 구분한 게 포인트예요.
🥇 1위: Sony WF-1000XM5 (약 28만 원대) 스펙 배터리: 이어폰 단독 8시간 / 실측: ANC ON + 중간 볼륨 기준 약 6.8시간. ANC 성능은 현재 이 가격대에서 압도적 1위입니다. 바람 소리 차단에 특히 강하고, 통화 품질도 개선됐어요. 단점은 가격과 케이스 크기. 주머니에 넣기 살짝 버거워요.
🥈 2위: Samsung Galaxy Buds3 Pro (약 22만 원대) 스펙 배터리: 6시간 / 실측: ANC ON 기준 약 5.3시간. 갤럭시 스마트폰 사용자라면 연동 완성도가 압도적입니다. 360 Audio, 자동 전환 기능이 타 제품 대비 매끄러워요. 단, 안드로이드 비사용자에겐 기능의 절반이 날아가는 단점이 있습니다.
🥉 3위: Anker Soundcore Liberty 4 NC (약 9만 원대) 스펙 배터리: 10시간 / 실측: ANC ON 기준 약 7.4시간 — 실측이 스펙에 가장 근접한 제품. 가격 대비 ANC 품질이 놀라운 수준이에요. LDAC 지원까지 됩니다. 다만 공간 음향 품질과 마이크 성능은 상위 제품 대비 체감 차이가 납니다. ‘예산 15만 원 이하’라면 이게 정답입니다.
가격대별 스펙 비교표
제품명
가격(2026 기준)
ANC
실측 배터리
멀티포인트
코덱
추천 대상
Sony WF-1000XM5
약 28만 원
★★★★★
6.8시간
O (2대)
LDAC, AAC
음질·ANC 최우선
Samsung Galaxy Buds3 Pro
약 22만 원
★★★★☆
5.3시간
O (2대)
SSC, AAC
갤럭시 생태계 사용자
Apple AirPods Pro 2
약 35만 원
★★★★★
6.0시간
X
AAC
아이폰 사용자 전용
Anker Soundcore Liberty 4 NC
약 9만 원
★★★☆☆
7.4시간
O (2대)
LDAC, AAC
예산 제한, 가성비 최우선
Jabra Evolve2 Buds
약 40만 원
★★★★☆
7.0시간
O (3대)
AAC
재택·비즈니스 통화 중심
해외 리뷰 사이트가 말하는 ‘진짜 단점’
RTINGS.com, The Verge, SoundGuys — 세 군데를 교차 확인하면 국내 리뷰에선 잘 안 나오는 단점들이 보입니다.
Sony WF-1000XM5: RTINGS 기준 저음 왜곡(THD)이 고음량에서 다소 올라감. 클래식·보컬 장르엔 최고지만 EDM 고볼륨 리스너에겐 살짝 아쉬울 수 있어요.
Galaxy Buds3 Pro: SoundGuys 실측에서 바람 소리 차단이 소니 대비 약 18% 낮게 측정됨. 야외 러닝이 메인이라면 주의.
AirPods Pro 2: 멀티포인트 미지원이 2026년에도 여전히 치명적. 맥북+아이폰 전환은 자동이지만, 그 외 기기 연결 시 수동 전환 필요.
Anker Liberty 4 NC: 마이크 성능이 바람 많은 환경에서 급격히 떨어짐. 화상회의가 잦은 환경이라면 비추천.
무선 이어폰 살 때 절대 하지 말아야 할 실수 5가지
❌ 스펙 배터리만 보고 구매: ANC ON + 고볼륨 조건에서 스펙 대비 20~30% 감소는 기본입니다. 반드시 실측 리뷰를 확인하세요.
❌ 생태계 무시하고 구매: 갤럭시 버즈를 아이폰에 연결하면 ANC 조절, 공간 음향, 제스처 커스텀 기능이 대부분 사라집니다. 반드시 본인 기기와 호환성 확인.
❌ 귀 모양 무시하고 오픈핏 선택: 오픈핏(귓구멍을 막지 않는 방식)은 운동용엔 좋지만, ANC 효과가 구조적으로 떨어집니다. 지하철 출퇴근이 메인이라면 인이어형을 고르세요.
❌ 반품 안 되는 곳에서 이어팁 없이 구매: 이어팁 사이즈가 안 맞으면 음질과 ANC 효과가 50% 이상 떨어집니다. 꼭 직접 착용해보거나, 반품 가능한 채널에서 구매할 것.
❌ 1년 전 리뷰 참고: 펌웨어 업데이트로 ANC 성능이 크게 달라지는 경우가 많아요. 2026년 기준 최신 리뷰를 참조하세요.
FAQ
Q1. AirPods Pro 2가 비싼데, 안드로이드 폰에 써도 될까요?
결론만 말하면, 비추천합니다. AAC 코덱만 지원되고, 공간 음향·자동 전환·배터리 UI 등 핵심 기능이 iOS 전용이에요. 같은 돈이면 Sony WF-1000XM5가 훨씬 합리적인 선택입니다.
Q2. LDAC이 뭔가요? 꼭 필요한가요?
LDAC은 소니가 개발한 고음질 블루투스 코덱으로, 최대 990kbps 전송이 가능합니다. SBC(328kbps) 대비 약 3배 데이터량이에요. 단, Android 8.0 이상 기기에서만 활성화되고, 스트리밍 앱도 ‘고음질 설정’이 돼 있어야 체감 차이가 납니다. 멜론·스포티파이 무료 사용자라면 솔직히 큰 의미 없어요.
Q3. 운동할 때 쓸 이어폰 따로 사야 하나요?
운동 전용이라면 방수 등급(IPX5 이상)과 귀에서 안 빠지는 핏이 최우선입니다. 이 경우 Beats Powerbeats Pro 2세대나 Jabra Elite Active 시리즈처럼 귀걸이 타입이 훨씬 유리해요. 고음질 이어폰을 운동용으로 쓰다 땀으로 고장 내는 경우가 생각보다 많습니다.
결론 — 한 줄 평
2026년 무선 이어폰 시장, 솔직히 말하면 10만 원 이하 제품들이 무섭게 올라왔어요. 무조건 비싼 걸 살 필요는 없습니다. 예산 15만 원 이하라면 Anker Liberty 4 NC, 갤럭시 사용자라면 Buds3 Pro, 생태계 상관없이 음질·ANC 최고를 원한다면 Sony WF-1000XM5 — 이 세 가지 기준만 기억하면 실패 없습니다.
결국 이어폰은 ‘귀에 꽂히는 시간’이 많은 사람일수록, 싸게 사는 게 더 비싼 결과를 낳아요. 후회 없는 선택 하세요.
A friend of mine came back from Punta Cana last spring looking completely defeated. She’d spent nearly $4,000 on a week-long trip and spent most of it stuck inside an all-inclusive resort that, in her words, ‘could have been in Cancún or Orlando for all I knew.’ The beach was beautiful, sure, but she never found the Punta Cana that the travel brochures promised — the one with hidden coves, local rum shacks, and the kind of sunset that makes you question your entire life plan. Her story stuck with me, and it’s exactly why I started digging into what a Punta Cana trip actually looks like when you go beyond the resort bubble.
So let’s explore this together, because honestly, Punta Cana in 2025 is a tale of two completely different destinations depending on how you approach it.
The All-Inclusive Trap: Why Most Visitors Miss the Real Punta Cana
Here’s the uncomfortable truth: the Hotel Zone (Bávaro-Punta Cana strip) is essentially a 30-mile wall of resorts designed to keep your dollars inside. According to the Dominican Republic Ministry of Tourism’s 2024 annual report, over 73% of international visitors to Punta Cana never leave their resort complex for a meal or cultural experience. That’s not an accident — it’s architecture.
The average all-inclusive package in 2025 runs between $280–$480 per person per night at mid-tier properties like Riu Palace, Barceló Bávaro, and Hard Rock Punta Cana. Luxury options like Sanctuary Cap Cana or Tortuga Bay push past $900/night. What you’re buying is convenience, not authenticity. The math makes the resort model very appealing on paper, but the experience often feels like a beautiful, high-end void.
Where it goes wrong: resort beaches, while technically accessible by Dominican law (all beaches are public), are operationally gatekept through chair and service monopolies. Try sitting on Bávaro Beach without a wristband and you’ll understand immediately.
The Route Locals Actually Use in 2025
Here’s what changes everything: rent a car or hire a private driver for $50–$80 USD per day through a local agency (avoid the airport counters — prices are 40% higher there). Local agencies like Sixt Punta Cana Local or connections through your Airbnb host are reliable options. With wheels, the entire eastern tip of Hispaniola opens up.
Mano Juan, Saona Island: Skip the $120 catamaran party tour. Take the public ferry from Bayahibe (about 45 minutes southwest by car) for roughly $15 round trip. You arrive before the tour groups and leave after them. The village has maybe 300 residents, no resort hotels, and a fish lunch at Comedor Wendy runs under $8.
Uvero Alto: 40 minutes north of the main strip on Highway 103. The beach here is wider, calmer, and largely uncrowded even in high season (December–April). Bring your own food and drinks — facilities are minimal, which is the whole point.
El Cortecito Fishing Village: Technically inside the resort zone but almost always skipped. Local fish restaurants like El Pulpo serve fresh catch plates for $10–$15. The contrast with the resort buffets 500 meters away is jarring and wonderful.
Higüey Basilica (La Altagracia): 45-minute drive inland. The modern basilica completed in 1971 is architecturally striking — think Oscar Niemeyer meets Gothic spire. Entry is free, the surrounding market sells locally made amber and larimar jewelry at 60–70% below resort shop prices.
Playa Limón: Two hours north via Highway 104 through Los Haitises National Park territory. Completely undeveloped, no facilities whatsoever, and one of the few places in the Caribbean where you can genuinely be alone on a pristine beach. Go in the dry season (January–March) — the road becomes impassable in heavy rain.
Timing, Costs, and the Off-Season Advantage
High season (mid-December through April) brings peak pricing and crowds. Flight prices from major US hubs run $350–$650 round trip during this window. But here’s the local secret: May and June before the hurricane season peaks offer dramatically lower prices (flights drop to $180–$280, hotel rates fall 35–45%) with weather that’s actually quite manageable — afternoon showers, not all-day storms. The resorts are quieter, day-trip sites like Saona Island feel almost private, and locals are genuinely more relaxed.
Hurricane season proper (August–October) carries real risk. The Dominican Republic has seen significant impacts from storms in recent years — don’t gamble with this window unless you’re hyper-flexible with cancellation policies.
Practical cost breakdown for a 7-day trip in 2025 using the local route approach:
Flights (from US East Coast, May shoulder season): ~$220–$300 round trip
Accommodation (Airbnb in El Cortecito or Bávaro residential area): $65–$120/night
Car rental (local agency, 5 days): $50–$65/day including basic insurance
Activities (Saona ferry, park entries, guides): $80–$150 total for the week
Total estimated spend: $1,100–$1,800 per person — roughly half the all-inclusive resort package cost
What to Watch Out For: The Real Friction Points
Let me be direct about where things can go sideways so you’re not caught off guard:
Sanky-panky tourism economy: The beach vendor and “local guide” scene around the resort strip is highly transactional. Polite, firm “no gracias” works. Don’t engage beyond that — extended conversation is interpreted as negotiating interest.
Road conditions: Highway 104 north toward Miches and Playa Limón has serious potholes. A standard sedan will bottom out. Rent a SUV if you’re venturing north. This isn’t optional advice.
Drinking water: Tap water is not safe for travelers’ consumption anywhere in the country. Budget for bottled water ($0.50–$1 per large bottle locally) or use a filtered bottle system.
Health insurance and the Tourist Card: The Dominican Republic Tourist Card ($10, often included in flight prices) is required. Verify before arrival. Separately, travel insurance with medical evacuation coverage is genuinely worth it here — the nearest internationally accredited hospital to the resort zone is Hospiten Bávaro, which is solid but expensive without coverage.
Alternative Framing: When the All-Inclusive Actually Makes Sense
Here’s where I want to push back against reflexive all-inclusive bashing, because sometimes it genuinely is the right call. If your situation is: traveling with young children under 8, celebrating a honeymoon where logistics should disappear, or coming specifically for a golf retreat (Punta Cana has some legitimately world-class courses including the Corales Golf Club, which hosted the PGA Tour Champions in 2024), then a well-chosen all-inclusive removes friction in ways that have real value.
The key is choosing the right property. Tortuga Bay (designed by Oscar de la Renta, part of Puntacana Resort) stands apart because it’s actually integrated with the local community — their Ecological Reserve and farm are accessible to guests and genuinely connect to Dominican ecology. It’s expensive at $600–$900/night, but it’s a different philosophical product than a factory-resort.
If your budget is mid-range and you want resort comfort without full isolation, the Nickelodeon Hotels & Resorts Punta Cana has surprisingly good excursion partnerships with local operators built into packages — an underrated choice for family trips in 2025.
Reader Note: Punta Cana rewards the curious and punishes the passive. The difference between a forgettable resort week and a genuinely transformative Caribbean experience often comes down to one decision: will you rent that car on day two? Based on everything I’ve seen researched and heard from people who’ve done both, the answer that leads to better stories — every single time — is yes.
얼마 전 위스키 좀 마신다는 친구가 연락이 왔어. “야, 발베니 12년이랑 글렌피딕 15년 중에 뭐 사야 해?” 근데 내가 되물었지. “너 예산이 얼마야?” 10만원 초중반이라고 하더라. 그래서 내가 한마디 했어. “그 두 개 말고 내가 추천하는 거 사봐.” 그 친구 지금 내 말 들은 거 엄청 고마워하고 있거든.
솔직히 말할게. 위스키 시장은 마케팅의 바다야. 브랜드 파워, 포장, 인플루언서 협찬… 실제 액체 퀄리티랑 가격이 비례하지 않는 경우가 생각보다 훨씬 많아. 2026년 기준으로 환율도 오르고, 주세도 만만치 않은 상황에서 무조건 유명한 거만 사는 건 솔직히 돈 낭비일 수 있어.
그래서 오늘은 내가 직접 마시고, 비교하고, 때로는 후회도 하면서 걸러낸 10~15만원대 싱글몰트 위스키 Top 3를 뼈 때리는 솔직함으로 정리해줄게.
📋 목차
🥃 왜 비싼 위스키가 항상 좋은 건 아닌가 — 2026년 시장 현황
🏆 가성비 싱글몰트 Top 3 — Nose/Palate/Finish 완전 분석
📊 3종 비교표 — 가격, 도수, 스타일 한눈에 보기
🌍 해외 위스키 커뮤니티는 뭐라고 하나 — 실제 평가 정리
🚫 위스키 고를 때 절대 하지 말아야 할 실수
❓ FAQ — 독자들이 가장 많이 묻는 것들
✅ 결론 및 한 줄 평
🥃 왜 비싼 위스키가 항상 좋은 건 아닌가 — 2026년 시장 현황
2026년 현재, 국내 위스키 시장은 하이볼 문화의 확산으로 싱글몰트 입문자가 급격히 늘었어. 편의점에서도 위스키를 살 수 있는 시대잖아. 문제는 이 유입된 수요를 노리고 마케팅 비용이 가격에 전가된 제품들이 판을 치고 있다는 거야.
실제로 국내 주류 수입 통계를 보면 2025~2026년 싱글몰트 평균 소비자가격이 전년 대비 약 8~12% 상승했어. 근데 액체 자체의 퀄리티 향상은? 솔직히 그게 그거야. 숙성 연수 낮추고 NAS(No Age Statement)로 전환한 브랜드들도 수두룩해. 그 대신 병 디자인만 화려해졌지.
그러니까 지금이야말로 ‘브랜드 프리미엄’이 아닌 ‘액체 퀄리티’로 선택해야 할 타이밍이야.
🏆 가성비 싱글몰트 Top 3 — Nose/Palate/Finish 완전 분석
🥇 1위: 글렌모렌지 오리지날 10년 (Glenmorangie Original 10Y)
가격대: 약 65,000~80,000원 (700ml 기준)
하이랜드 출신, 세계에서 가장 키가 큰 증류기로 만든다는 그 위스키. 근데 마케팅 얘기는 됐고, 실제로 마셔본 소감을 말할게.
🌸 Nose (향): 첫 향이 정말 인상적이야. 복숭아, 살구 같은 달콤한 과일향이 먼저 오고, 그 뒤로 바닐라와 약한 플로럴 노트가 따라와. 전혀 공격적이지 않아서 위스키 초보자한테도 거부감 없어. 오크 향은 배경으로 살짝만 깔려 있고.
👅 Palate (미각): 입에서는 크리미한 질감이 일단 좋아. 달콤한 바닐라 크림, 복숭아 잼, 생강 쿠키 느낌. 알코올 자극이 적절하게 느껴지면서 지루하지 않아. 도수 43%인데 생각보다 훨씬 부드럽게 넘어가.
🔥 Finish (여운): 중간 길이의 피니시. 아몬드와 약간의 민트 느낌이 남고, 깔끔하게 마무리돼. 무겁지 않아서 두 잔 마시고 싶다는 생각이 드는 게 함정.
총평: 가격 대비 완성도가 상당히 높아. 하이볼로 만들면 또 다른 매력이 터지는 스타일. 입문자부터 중급자까지 모두 만족할 수 있는 ‘안전빵’ 선택지야. 10만원 이하에서 이 퀄리티면 진짜 이득.
🥈 2위: 아벨라워 12년 더블 캐스크 (Aberlour 12Y Double Cask)
가격대: 약 85,000~110,000원 (700ml 기준)
스페이사이드 위스키인데, ‘더블 캐스크’라는 말 그대로 아메리칸 오크와 쉐리 캐스크를 모두 거쳐. 쉐리 캐스크라고 하면 맥칼란 생각이 먼저 나겠지만, 맥칼란 12년은 지금 가격이 너무 올라서 가성비 리스트에서 탈락했어. 아벨라워는 아직 버텨주고 있고.
🌸 Nose (향): 쉐리 캐스크 영향이 확실히 느껴져. 건포도, 다크 체리, 약간의 초콜릿 향. 거기에 스페이사이드 특유의 사과, 배 같은 과일향이 밑에서 받쳐줘. 향 자체가 꽤 복잡하고 레이어드되어 있어서 한 번 맡고 또 맡게 돼.
👅 Palate (미각): 달콤하고 풍부해. 쉐리 캐스크에서 오는 건과일, 메이플 시럽, 그리고 살짝 스파이시한 계피 느낌. 미디엄 바디감이 있어서 가볍지 않고, 씹는 느낌도 있어. 알코올 43%지만 질감이 풍부해서 물이나 얼음 없이 니트로 마셔도 충분히 즐거워.
🔥 Finish (여운): 피니시가 길어. 쉐리 캐스크의 오크 타닌과 건과일 느낌이 목 뒤에서 오래 남아. 마지막에 살짝 쌉싸름한 다크 초콜릿 여운이 포인트.
총평: 맥칼란 12년 쉐리 오크 마시다가 가격이 부담됐던 사람들한테 진심으로 추천해. 쉐리 캐스크의 복잡함을 이 가격대에서 이 정도로 구현하는 건 아벨라워가 거의 독보적이야. 선물용으로도 손색 없어.
🥉 3위: 글렌알라키 10년 (GlenAllachie 10Y)
가격대: 약 90,000~120,000원 (700ml 기준)
아직 국내에서 완전히 대중화되진 않았지만, 위스키 마니아들 사이에서 “이거 진짜 가성비 미쳤다”는 말이 나오는 브랜드야. 빌리 워커라는 전설적인 마스터 블렌더가 인수해서 품질을 끌어올린 스페이사이드 증류소.
🌸 Nose (향): 처음엔 약간 닫혀 있어. 5분 정도 기다리면 열리는 타입. 블랙베리, 다크 플럼, 약간의 가죽 향이 나오고, 거기에 밀크 초콜릿과 토피 향이 얹어져. 절대 가볍지 않은 향이야.
👅 Palate (미각): 이게 진짜 인상적인 포인트야. 46% 캐스크 스트렝스에 가까운 도수인데도 냉각 여과(Chill-Filtration) 없이 자연 그대로 병입돼 있어서 오일리한 질감이 살아있어. 붉은 과일, 다크 초콜릿, 에스프레소 약간, 흑설탕 느낌. 복잡도로 치면 이 가격대 탑이야.
🔥 Finish (여운): 길고 따뜻해. 오크 스파이스와 다크 베리 잼 느낌이 오래 유지돼. 마신 후 30초가 지나도 입안에 뭔가 남아있다는 게 느껴지는 수준.
총평: 위스키를 좀 마셔봤다 싶은 사람이라면 이게 가장 충격적인 선택이 될 거야. 초보자한테는 약간 무거울 수 있지만, 중급자 이상한테는 “왜 진작 이걸 안 마셨지?” 하는 후회가 올 거야. 국내 재고가 들쑥날쑥해서 보이면 바로 사는 게 답이야.
📊 3종 비교표 — 가격, 도수, 스타일 한눈에 보기
항목
글렌모렌지 오리지날 10Y
아벨라워 12Y 더블캐스크
글렌알라키 10Y
원산지
스코틀랜드 하이랜드
스코틀랜드 스페이사이드
스코틀랜드 스페이사이드
숙성 연수
10년
12년
10년
도수
43%
43%
46%
캐스크 타입
아메리칸 화이트 오크
아메리칸 오크 + 쉐리 캐스크
다양한 캐스크 (쉐리 포함)
냉각 여과
있음
있음
없음 (Non-chill filtered)
가격대
65,000~80,000원
85,000~110,000원
90,000~120,000원
Nose 스타일
과일, 플로럴, 바닐라
건과일, 쉐리, 초콜릿
다크 베리, 가죽, 토피
입문자 적합도
⭐⭐⭐⭐⭐
⭐⭐⭐⭐
⭐⭐⭐
선물용 적합도
⭐⭐⭐⭐
⭐⭐⭐⭐⭐
⭐⭐⭐⭐
가성비 점수
9.2/10
8.8/10
9.5/10
🌍 해외 위스키 커뮤니티는 뭐라고 하나
해외에서 위스키 덕후들이 모이는 플랫폼으로는 Whiskybase, r/Scotch (Reddit), 그리고 Master of Malt 리뷰 섹션이 대표적이야. 이 채널들에서 위 3종을 어떻게 평가하고 있는지 실제로 확인해봤어.
글렌모렌지 오리지날 10Y: Whiskybase 평균 점수 82~84/100. “완벽한 입문 위스키”, “언제 마셔도 실망이 없는 안정감”이라는 평이 주를 이루고 있어. r/Scotch에서도 “입문자한테 첫 번째로 추천하는 보틀”로 자주 언급돼.
아벨라워 12Y 더블캐스크: Whiskybase 평균 85~87/100. “가격 대비 쉐리 캐스크 표현력이 탁월하다”, “맥칼란 12 쉐리 오크의 실질적인 대안”이라는 평가가 많아. Master of Malt에서도 에디터 픽으로 선정된 적 있어.
글렌알라키 10Y: Whiskybase 평균 87~89/100. “빌리 워커의 마법이 느껴지는 보틀”, “이 가격에 이 복잡함은 말이 안 된다”는 리뷰가 지배적이야. 특히 NON-chill filtered 방식을 높이 평가하는 의견이 많아.
🚫 위스키 고를 때 절대 하지 말아야 할 실수
❌ 가격 = 퀄리티로 무조건 믿지 마라. 마케팅 비용, 유통 단계, 브랜드 프리미엄이 가격에 상당 부분 포함돼 있어. 특히 국내 수입 유통 마진은 생각보다 커.
❌ 처음부터 피티드(peated) 위스키로 시작하지 마라. 아일라 위스키 특유의 연기 향은 호불호가 극명해. 입문자가 잘못 선택하면 위스키 자체가 싫어질 수 있어.
❌ 면세점이 무조건 싸다는 환상을 버려라. 2026년 기준 면세점 가격이 국내 온라인 최저가보다 비싼 경우가 심심치 않게 발생하고 있어. 구매 전에 반드시 비교해봐.
❌ ’12년 숙성 = 10년 숙성보다 무조건 좋다’ 는 오해. 숙성 연수는 하나의 지표일 뿐이야. 캐스크 품질, 증류소 스타일, 블렌딩 기술이 더 중요한 경우가 많아.
❌ 개봉 후 방치하지 마라. 위스키는 공기와 접촉하면 산화가 일어나. 병의 3분의 1 이하로 줄어들면 소분병(미니 보틀)에 옮겨 담거나 최대한 빨리 마시는 게 좋아. 와인처럼 며칠 만에 날아가진 않지만, 수개월 방치하면 풍미가 확실히 변해.
❌ 냉동실에 보관하지 마라. 상온 보관이 정답이야. 직사광선만 피하면 돼. 냉동 보관하면 향 분자가 닫혀버려서 제대로 된 노즈를 즐기기 어려워.
❓ FAQ
Q1. 글렌알라키 10년이 제일 좋다는 거야? 그럼 다른 두 개는 왜 추천해?
가성비 점수가 높다고 모든 상황에서 최선은 아니야. 글렌알라키는 위스키 좀 마셔본 사람한테 ‘충격과 공포’를 선사하는 타입이고, 글렌모렌지는 위스키를 처음 접하는 사람이나 하이볼 좋아하는 사람한테 완벽해. 아벨라워는 선물용이나 쉐리 캐스크 스타일이 좋은 사람한테 특화돼 있어. 상황에 따라 최선의 선택이 달라지는 거야.
Q2. 하이볼로 마시면 비싼 싱글몰트는 낭비 아닌가요?
이건 관점 차이인데, 솔직하게 말할게. 아주 복잡하고 깊은 위스키를 하이볼로 마시면 그 복잡함의 상당 부분이 탄산과 얼음에 희석되는 건 사실이야. 그래서 글렌알라키 같은 복잡한 보틀은 니트나 물 몇 방울 추가로 마시는 게 더 아깝지 않아. 반면 글렌모렌지 오리지날은 하이볼로 마셔도 과일 향이 잘 살아나서 찰떡이야. 용도에 맞게 써.
Q3. 국내에서 가장 믿을 만한 위스키 구매 채널이 어디예요?
2026년 기준으로 가장 안정적인 채널은 대형마트(이마트, 롯데마트) 주류 코너, 하이마트 주류 섹션, 그리고 각 브랜드 공식 수입사 온라인몰이야. 가격 비교는 ‘보틀닷컴’, ‘데일리샷’ 앱 등에서 할 수 있어. 중고 거래나 출처 불명 온라인 판매상은 진품 보증이 안 되니까 절대 피해.
✅ 결론 및 한 줄 평
오늘 소개한 세 가지 보틀 모두 15만원 이하에서 충분히 구매 가능한, 검증된 선택지들이야. 위스키 시장이 커질수록 마케팅으로 포장된 평범한 보틀들이 더 많이 쏟아질 거야. 그 사이에서 진짜 액체 퀄리티를 가진 보틀을 고르는 안목이 점점 더 중요해지고 있어.
🏆 내 최종 추천 순위:
위스키 입문자, 하이볼 애호가 → 글렌모렌지 오리지날 10Y
선물용, 쉐리 캐스크 팬 → 아벨라워 12Y 더블캐스크
중급 이상, 복잡함을 원하는 마니아 → 글렌알라키 10Y
오늘도 좋은 위스키 한 잔과 함께, 지갑은 현명하게. 비쌀수록 좋다는 건 위스키 세계에서는 절반만 맞는 말이야. 나머지 절반은 결국 네 입맛과 네 상황이 정하는 거야. 오늘 소개한 세 보틀 중 하나라도 기회가 되면 꼭 직접 마셔봐 — 말로만 들은 거랑 입에서 느끼는 건 완전히 다른 세계거든.
A friend of mine — seasoned traveler, been to 40+ countries — nearly missed a connecting flight at Incheon last spring. Not because of traffic or delays, but because she blindly trusted a directions app that routed her through a terminal transfer that no longer existed after a layout change. She made it, barely, with seven minutes to spare. That story stuck with me, and it got me thinking: how many of us are flying in 2025 still using transfer intel from 2022?
Let’s dig into what actually works for airport transfers right now, with real data, real gotchas, and the kind of advice you’d only get from someone who’s done this the hard way.
The Hidden Cost of ‘Convenient’ Transfer Options
Most travelers default to one of three options: ride-hail apps (Uber, Grab, Lyft), hotel shuttles, or the airport’s own rail/bus system. And on paper, all three look fine. But here’s where the data gets interesting.
According to a 2025 ACI World passenger survey, 34% of missed connections in major hub airports were attributed not to flight delays but to transfer logistics — specifically, underestimating time between arrivals and departure gates in different terminals. That’s a staggering number for something that feels entirely within our control.
Ride-hail pickup zones have also shifted dramatically post-pandemic. At LAX, the official Uber/Lyft pickup moved to the LAX-it lot — a 10-15 minute walk or shuttle ride from baggage claim. If you’re on a tight connection or have heavy luggage, that’s not a minor inconvenience. It’s a real risk factor.
LAX-it lot transfer time: Add 20-30 min buffer beyond app ETA
Heathrow Terminal hopping (T2 to T5): Minimum 45 min recommended by BAA, but real-world average is 55-65 min in peak hours
Changi Airport (Singapore): Still the gold standard — inter-terminal Skytrain runs every 3-4 min, 24/7, free of charge
Dubai DXB T1 to T3: Free airside transfer train, but T2 requires exiting and re-entering security — a fact buried in fine print
JFK AirTrain: $9.25 flat fee in 2025, but only connects to Jamaica or Howard Beach subway — not door-to-door
What the Locals Actually Do (And Why It’s Not on TripAdvisor)
When I asked a gate agent at Frankfurt Airport what she tells her own family when they visit, she didn’t mention any app. She said: “Check the airport’s own official transfer map, updated quarterly, not the third-party aggregator.” That’s the key insight most bloggers skip.
Airport official websites — FRA, HND, SIN, AMS — all publish real-time terminal maps and estimated walking/transit times that are updated seasonally. Google Maps, by contrast, often pulls from static data that can lag by 6-18 months. For construction-heavy airports like O’Hare (currently mid-renovation through 2026) or Narita (T1/T2 connector upgrade ongoing), this gap is genuinely dangerous for planning.
For international hubs, here’s a quick reference based on 2025 conditions:
Tokyo Narita (NRT): T1 and T2 connected landside only — budget 40 min minimum; T3 (LCC terminal) requires a bus, 15-20 min ride, runs every 10 min
Amsterdam Schiphol: Rare single-terminal layout — most transfers are smooth 15-25 min walks, but passport control queues post-2024 Schengen rule changes now regularly hit 30-40 min
Bangkok Suvarnabhumi (BKK): A massive footprint deceives you — gate-to-gate in different concourses can exceed 25 min walking alone
Istanbul IST: New mega-airport, but the sheer scale means inter-concourse distances of up to 900 meters; buggy service available but inconsistent
Pre-Booking vs. On-Demand: Which Actually Saves You Money in 2025
Here’s a nuance most ‘travel hack’ listicles gloss over: pre-booked transfers are not always cheaper, but they are almost always more predictable — and predictability has real monetary value when you factor in missed-flight rebooking costs.
In 2025, a typical economy rebooking fee on a legacy carrier runs $150-$300 USD. A pre-booked private transfer from CDG to central Paris might cost €65-€85 versus €45-€55 for the RER B train. The math on ‘saving €20’ looks very different when you imagine that train being delayed during a strike week (France averages 12-15 transport strike days per year) and you’ve got a meeting the next morning.
Services worth knowing about in 2025:
Blacklane: Premium fixed-rate transfers, now operating in 50+ countries, app-based with meet-and-greet; pricing is 20-30% above standard taxi but includes real-time flight monitoring
KiwiTaxi / Welcome Pickups: Mid-range options popular in Europe and Southeast Asia, fixed pricing, good English-language support
Airport Express Trains: Where available (HKG, CDG, ARN, CPH), these are still the fastest and most reliable options — just validate ticket validity windows
Hotel shuttles: Free but inflexible — usually run on fixed schedules (every 30-60 min), can strand you if your flight lands early or late
The Realistic Checklist Before Your Next Transfer
Rather than a blanket ‘always do X’, here’s how to think about it conditionally:
If your layover is under 90 minutes: Do not rely on public transit in any large-footprint airport. Pre-book or use airside connections only.
If you’re traveling with checked luggage through a connection: Confirm whether bags are checked through to final destination — this completely changes your terminal logic.
If the airport is undergoing construction (check official site): Add 30% buffer time to any estimated transfer time, no exceptions.
If it’s peak season (June-August, Dec 20 – Jan 5): Security queue times at major hubs can double or triple — factor this in especially at EU airports with Schengen/non-Schengen splits.
If you’re arriving internationally and connecting domestically in the US: You MUST clear customs and re-check bags — minimum 2-hour buffer is not excessive, it’s baseline.
What I’d Do Differently Today
Honestly, the single highest-leverage habit I’ve built is spending 10 minutes on the destination airport’s official website — not an app, not a travel blog — the morning of travel. Bookmark the specific terminal map PDF. Check if there are any announced closures or gate changes. It takes one coffee’s worth of time and has saved me real stress on multiple occasions.
The second habit: screenshot your boarding passes and the terminal layout offline. Airport WiFi is notoriously unreliable right when you need it most, and signal drops in some of the larger international terminals are genuinely frequent.
We’re in an era where travel infrastructure is changing faster than most informational content about it. The 2025 airport experience at a place like ORD or CDG is genuinely different from three years ago — different pickup zones, different security flows, different transit options. Treat your transfer planning like you’d treat checking your tire pressure before a long drive. It’s not glamorous, but it’s the thing that keeps the whole trip on track.
💬 Have you had a close call with an airport transfer that didn’t go as planned? Drop your story below — the more specific the airport and situation, the more useful it is for everyone reading this.
지난달에 친한 후배가 카톡을 보냈어요. “형, 나 QQQ 400만 원어치 샀는데 맞죠?” 솔직히 말하면 틀리지는 않았는데, 그냥 따라 산 거라 불안했거든요. 왜 샀냐고 물어보니 “유튜브에서 추천해줬어요”라는 대답이 돌아왔습니다. 그 순간 이 글을 써야겠다고 결심했어요. ETF는 분명히 좋은 투자 도구인데, ‘어떤 걸’, ‘왜’, ‘얼마나’ 사야 하는지 모르면 그냥 복권이에요. 2026년 현재 금리·환율·AI 모멘텀이 복잡하게 얽힌 시장에서 개미가 진짜 돈 버는 미국 ETF 세 가지를 직접 분석하고 골라봤습니다.
📌 1. 지금 미국 ETF 시장, 뭐가 달라졌나? (2026년 맥락 정리)
📌 2. TOP 3 ETF 심층 분석 — 수익률·비용·리스크 다 꺼냄
📌 3. 한눈에 보는 ETF 비교표
📌 4. 국내외 투자자들이 실제로 선택한 포트폴리오 사례
📌 5. 절대 하지 말아야 할 ETF 매수 실수 5가지
📌 6. FAQ — 댓글에서 제일 많이 물어보는 것들
📌 7. 결론 및 한 줄 평
1. 지금 미국 ETF 시장, 뭐가 달라졌나? (2026년 맥락 정리)
2026년 현재 미국 시장의 핵심 변수는 세 가지입니다. ①연준(Fed)의 금리 동결 기조 유지, ②AI 인프라 투자 2라운드 본격화, ③달러 강세 완화에 따른 신흥국 자금 재유입. 이 세 흐름을 이해하지 못하면 10년 전 잘나갔던 ETF를 지금 사는 실수를 반복하게 됩니다.
실제로 2022~2023년 금리 급등기에 ARK Innovation ETF(ARKK)는 고점 대비 -75%까지 빠졌어요. 당시 ‘혁신 기업 장기 투자’라는 논리로 진입한 개인 투자자들의 손실은 처참했습니다. 반면 같은 기간 배당+가치주 중심의 SCHD는 -20% 수준으로 방어하고, 배당을 꼬박꼬박 챙겼죠. 시장 맥락이 ETF 선택보다 먼저입니다.
2026년 현재 운용 보수(Expense Ratio) 전쟁도 치열해졌어요. Vanguard, BlackRock, Schwab이 0.03~0.05% 수준으로 수렴하면서, 이제 보수율로 ETF를 고르는 건 의미가 많이 줄었습니다. 대신 유동성(일평균 거래량), 추적 오차(Tracking Error), 분배금 지급 안정성이 실전 선택 기준이 됐어요.
2. TOP 3 ETF 심층 분석 — 수익률·비용·리스크 다 꺼냄
🥇 1위 — VOO (Vanguard S&P 500 ETF)
“지루한 게 최고야”의 끝판왕
S&P 500 지수를 추종하는 ETF 중 가장 낮은 운용보수(0.03%)와 압도적인 순자산(약 5,800억 달러, 2026년 기준)을 자랑합니다. 10년 연환산 수익률은 약 12.4%(분배금 재투자 포함)로, 같은 기간 액티브 펀드의 90% 이상을 이겼어요.
상승 시나리오: AI 생산성 혁명이 기업 이익률을 끌어올리면 S&P 500 EPS 성장률 10%+, VOO 연 15% 이상 수익 가능.
손실 시나리오: 경기침체 + 신용 경색 발생 시 2008년 기준 -38% 최대 낙폭 경험. 100만 원 투자 시 62만 원이 되는 구간을 버텨야 함. 이걸 버티지 못하면 VOO도 독이 됩니다.
🥈 2위 — SCHD (Schwab U.S. Dividend Equity ETF)
“배당이 월급인 사람”에게 최적
배당 성장주 100개를 담은 ETF로, 2026년 현재 분배금 수익률 약 3.5~3.8%를 유지하고 있어요. 운용보수 0.06%, 10년 배당 성장률 CAGR 약 11.2%. 단순히 배당이 높은 게 아니라, 배당을 매년 늘려온 기업에 집중한다는 게 핵심입니다.
상승 시나리오: 금리 하락 국면 진입 시 배당주 프리미엄 부각, 가격 수익 + 배당 합산 15%+ 가능.
손실 시나리오: 성장주 랠리 구간에서는 VOO 대비 언더퍼폼. 2023년 기준 VOO +26.2% vs SCHD +3.7%의 처참한 격차가 실제로 있었음. 성장장에서는 상대적 박탈감을 각오해야 합니다.
NVIDIA(NVDA), TSMC, ASML, Broadcom 등 글로벌 반도체 대장주들을 한 바구니에 담습니다. 운용보수 0.35%로 앞의 둘보다 비싸지만, 3년 누적 수익률이 압도적입니다(2023~2025년 약 +210% 수준). AI 데이터센터 투자가 계속되는 한 반도체 수요는 구조적으로 증가합니다.
상승 시나리오: AI 모델 고도화 → GPU/HBM 수요 폭증 → NVDA, TSMC 실적 재가속 → SMH 연 30%+ 가능.
손실 시나리오: 반도체 업황 사이클 하락 + 미중 수출 규제 강화 시 단기 -40~50% 가능. 2022년에 실제로 -50% 찍었습니다. 변동성을 감당할 자신이 없으면 비중 10~15% 이하로 제한하세요.
3. 한눈에 보는 ETF 비교표
항목
VOO
SCHD
SMH
추종 지수
S&P 500
배당 성장주 100
반도체 25개사
운용보수
0.03%
0.06%
0.35%
배당 수익률
약 1.3%
약 3.5~3.8%
약 0.4%
10년 연환산 수익률
약 12.4%
약 11.8%
약 22.1%
최대 낙폭(MDD)
약 -38%
약 -26%
약 -52%
추천 투자 성향
안정 + 성장 균형
현금흐름 중시
고위험 고수익
포트폴리오 비중 제안
50~60%
25~30%
10~20%
환율 민감도
중간
낮음
높음
4. 국내외 투자자들이 실제로 선택한 포트폴리오 사례
국내 증권사 MTS 데이터(키움증권, 삼성증권 해외주식 보고서, 2026년 1분기 기준)에 따르면, 국내 개인 투자자의 미국 ETF 매수 상위 5종목에 VOO, QQQ, SCHD가 나란히 이름을 올리고 있습니다. 특히 30~40대 직장인 투자자 사이에서 VOO 60% + SCHD 30% + SMH 10% 조합이 인기를 끌고 있어요.
미국 현지에서도 Reddit r/Bogleheads 커뮤니티에서는 여전히 VOO 단일 포트폴리오(혹은 VTI)를 고집하는 투자자가 다수입니다. “괜히 복잡하게 나눌수록 수익률이 낮아진다”는 주장인데, 장기(20년+) 데이터로는 실제로 맞아요. 다만 한국 투자자 특성상 환율 헤지 수요와 단기 자금 운용 필요성이 미국 투자자보다 높아서, SCHD처럼 배당으로 현금흐름을 만드는 전략이 더 현실적으로 맞습니다.
Morgan Stanley의 2026년 ETF 시장 보고서에서는 AI 인프라 사이클 2라운드 수혜 섹터로 반도체, 전력망, 데이터센터 리츠를 꼽았고, SMH 같은 반도체 테마 ETF에 대한 기관 비중 확대가 관측된다고 밝혔습니다.
5. 절대 하지 말아야 할 ETF 매수 실수 5가지
🚫 유튜브 추천만 보고 당일 시장가 매수: ETF도 단기 과열 구간이 존재합니다. RSI 70 이상, 52주 신고가 돌파 직후 추격 매수는 단기 조정 리스크가 크게 올라가요. 분할 매수(DCA)가 기본입니다.
🚫 환율 무시하고 매수: 원화가 강세(달러 약세)일 때 미국 ETF를 사면 환차손이 수익률을 갉아먹습니다. 달러 환율이 1,200원대 이하면 한 번쯤 고민해보세요.
🚫 레버리지 ETF를 장기 보유: TQQQ, SOXL 같은 3배 레버리지는 ‘변동성 손실(Volatility Decay)’ 때문에 장기 보유 시 기초 자산보다 수익률이 낮아지는 구조입니다. 단기 트레이딩 도구예요, 적립식 투자 상품이 절대 아닙니다.
🚫 분배금(배당) 세금 계산 안 하기: 미국 ETF 분배금에는 15% 원천징수가 되고, 연간 배당소득이 2,000만 원 초과 시 금융소득 종합과세 대상이 됩니다. 세후 수익률로 계산하는 습관이 필수입니다.
🚫 폭락장에서 전량 손절: VOO가 -30% 빠졌을 때 팔면 그냥 손실 확정입니다. 역사적으로 S&P 500은 모든 -30% 이상 구간 이후 신고가를 회복했어요. 손절 기준이 없으면 공포에 팔고 후회하는 사이클을 반복하게 됩니다.
FAQ
Q1. VOO랑 SPY 중에 뭘 사야 하나요?
수익률은 거의 동일합니다. 결정적 차이는 운용보수예요. VOO가 0.03%, SPY가 0.0945%로 VOO가 약 3배 저렴합니다. 장기 투자자라면 VOO, 단기 트레이딩이나 옵션 전략 병행 시에는 유동성이 더 좋은 SPY를 택하는 게 실전에서 유리합니다.
Q2. SCHD가 국내에서 직접 투자 안 되나요? ACE 미국배당다우존스 ETF도 같은 건가요?
정확히는 ‘같은 지수를 추종하는 국내 상장 ETF’입니다. ACE 미국배당다우존스, SOL 미국배당다우존스(SCHD) 등이 대표적이에요. 원화로 매수 가능하고 분배금도 원화로 나오지만, 운용보수가 0.01~0.05% 추가되고 추적 오차가 미세하게 존재합니다. 세금 처리가 편한 걸 원하면 국내 상장판, 원본 ETF를 직접 들고 싶으면 미국 직접 투자하세요.
Q3. 지금 당장 한 번에 목돈을 넣어야 할까요, 분할 매수해야 할까요?
학문적으로는 ‘목돈 일시 투자’가 분할 매수보다 2/3 확률로 수익률이 높습니다(Vanguard 연구, 장기 데이터 기준). 하지만 심리적으로 버티지 못하면 의미 없어요. -20% 빠졌을 때 팔지 않을 자신이 있으면 일시 투자, 불안하면 6~12개월 분할 매수로 진입 단가를 평준화하세요. 수익률보다 멘탈 관리가 먼저입니다.
결론 — 2026년 ETF, 이렇게 정리합니다
솔직히 말하면 ETF는 ‘뭘 사느냐’보다 ‘얼마나 오래, 흔들리지 않고 들고 있느냐’가 수익률을 결정합니다. VOO 하나만 10년 들고 있었던 사람이 매달 ETF 갈아탄 사람보다 거의 대부분 이겼어요. 그래도 2026년 시장 맥락에서 굳이 세 개를 고르라면 VOO(코어) + SCHD(현금흐름) + SMH(위성) 조합이 가장 균형 잡혔다고 봅니다. 한 줄 평: “지루할수록 잘 사는 게 ETF 투자의 진리다.”
단, SMH는 비중 관리 실패하면 계좌 반토막 납니다. 이 글을 읽은 여러분만큼은 그 실수 없길 바랍니다.
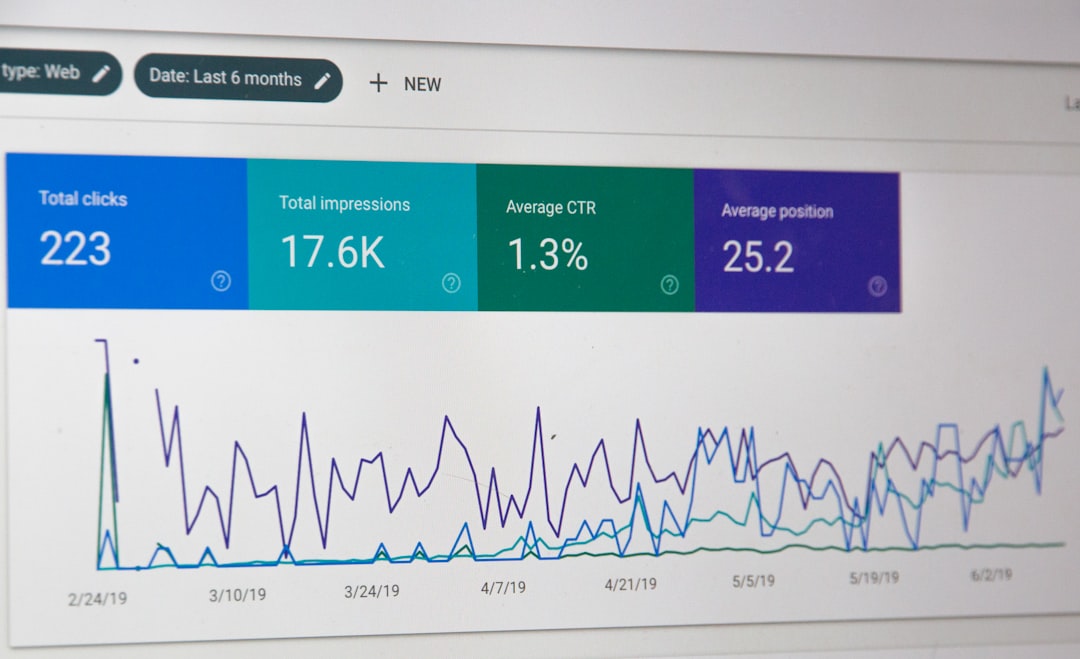
A friend of mine — a freelance content writer who’d been grinding for about two years — told me something that stuck with me: “I followed every SEO tutorial I could find, ranked for a handful of keywords, and still made almost nothing.” She wasn’t doing anything obviously wrong. She was publishing consistently, targeting low-competition terms, doing everything the guides said. And yet, traffic wasn’t converting. Sound familiar?
That conversation sent me down a rabbit hole I’m honestly glad I fell into. Because what she was experiencing isn’t a traffic problem — it’s a keyword intent mismatch problem. And it’s way more common than most SEO blogs will admit.
Let’s dig into what keyword research actually means in 2025, why the old playbook is quietly breaking down, and what a smarter approach looks like in practice.
The 2025 Keyword Landscape Has Shifted — Here’s the Data
If you’re still treating keyword research as a volume-and-difficulty game (find high-volume, low-KD terms, write content, rank), you’re playing a version of SEO that search engines have been quietly deprecating since at least 2022. In 2025, Google’s Search Generative Experience (SGE) and AI Overviews are now surfacing direct answers for a massive swath of informational queries — some estimates from BrightEdge’s 2024 research put AI Overview appearances at roughly 42% of all search queries in certain niches.
What that means practically: targeting pure informational keywords like “what is content marketing” or “how does SSL work” is increasingly a race to get quoted by the AI, not to rank in position one. The click-through rate for position one on an SGE-covered query can drop by 30–60% compared to a non-covered SERP, according to data from Authoritas.
So where does that leave keyword research? It actually makes it more important — just differently important.
Intent Mapping: The Part Most Tutorials Skip
Here’s the framework shift that made the biggest difference for me. Instead of starting with volume, I now start with intent clustering. Every keyword falls somewhere on this spectrum:
Informational (I-type): User wants to learn. High AI Overview risk. Still valuable for brand trust and topical authority, but don’t expect direct revenue here.
Navigational (N-type): User is looking for a specific brand or site. Hard to capture unless you are that brand.
Commercial Investigation (CI-type): User is comparing options before buying. This is where the money is. Think “best X for Y use case”, “X vs Y comparison”, “is X worth it in 2025”.
Transactional (T-type): User is ready to buy. High conversion, but often dominated by e-commerce giants. Viable with the right niche and domain authority.
The sweet spot for most content creators and small businesses in 2025 is the CI-type. These keywords are specific enough to dodge AI Overviews (because the answer isn’t a simple fact), competitive enough to have real search volume, and directly tied to someone with their wallet out.
Tools, Real Numbers, and What to Actually Look At
Let me get concrete. I run keyword research across three tools depending on what I’m after:
Ahrefs: My primary tool for KD (Keyword Difficulty) and traffic potential. One thing people miss — don’t just look at KD score. Click on the SERP overview for any keyword and check how many of the top 10 results have fewer than 30 referring domains. If 3+ results do, that’s a real opening.
Semrush’s Keyword Magic Tool: Best for finding CI-type variants at scale. Filter by intent (set to “Commercial” + “Investigational”), then sort by CPC — higher CPC often signals real buyer intent even if absolute volume looks modest.
Google Search Console + People Also Ask scraping: Completely free and criminally underused. Your existing GSC data shows you which queries are already landing people on your site with low average position (11–20 range) — those are your fastest wins with optimization, not new content.
One specific workflow that’s worked well: I pull a seed keyword into Ahrefs, look at the “Also rank for” column on the top-ranking pages, then filter that list by KD under 25 and volume over 300. That sweet spot consistently surfaces gems that pure keyword tools miss because they’re thinking about the topic, not the query.
Case Studies: What’s Actually Working Right Now
A SaaS blog in the project management space — one I’ve been watching closely through their public case studies — shifted their keyword strategy in early 2024 away from broad “productivity tips” content toward hyper-specific CI queries like “Asana vs Monday for construction teams” and “best Gantt chart tool for freelancers under $20/month”. Their organic traffic stayed flat, but their trial sign-ups from organic nearly doubled within six months. The volume on those keywords? Often under 500 searches/month. The conversion rate? 4–6x higher than their broad informational traffic.
On the e-commerce side, a Shopify store selling ergonomic office gear (documented on the Shopify blog’s merchant success series) found that targeting “best ergonomic chair for short people” outperformed “best ergonomic chair” despite having roughly 1/10th the search volume — because the specificity matched exactly who was ready to buy.
These aren’t anomalies. They reflect a broader pattern: specificity signals intent, and intent drives conversion.
The Mistakes That Still Haunt Most Keyword Strategies
Chasing volume without checking SERP reality: A keyword showing 10,000 monthly searches might have an AI Overview eating 50% of clicks and a SERP full of Reddit and Quora results — which actually signals opportunity, but for a very different content format than you’d think.
Ignoring cannibalization: Publishing three slightly different posts targeting overlapping keywords splits your authority. Use Ahrefs Site Explorer’s “Organic Keywords” report filtered to a URL to see if you’re competing with yourself.
KD score as a standalone metric: Moz’s and Ahrefs’ KD scores measure link competition, not topical authority competition. A KD of 15 in a niche where every top result is a dedicated expert site is harder than a KD of 40 in a fragmented market.
Skipping the “what would satisfy this searcher” test: Before targeting any keyword, Google it yourself. If the results look nothing like what you planned to write, you’ve misread the intent.
A Realistic Starting Point for 2025
If you’re rebuilding your keyword strategy from scratch right now, here’s the sequence I’d actually recommend:
Identify your 5–10 core topics (not keywords — topics).
For each topic, use Semrush or Ahrefs to build a list of CI-type and T-type keywords with volume between 200–2,000 and KD under 30.
Manually SERP-check every candidate. Look for: Are there forum threads in the top 10? Are any top-ranking pages thin or outdated (pre-2023)? Is there an AI Overview? Flag your best opportunities based on these signals, not just numbers.
Build a content cluster — one strong pillar page targeting a broader term, supported by 3–5 satellite posts targeting specific sub-intents. This signals topical depth, which matters more to Google’s helpful content systems than individual keyword optimization.
Revisit Google Search Console every 30 days to catch emerging query patterns you didn’t plan for.
The honest reality? Keyword research in 2025 takes more judgment than it used to. The data is more abundant and the tools are more powerful, but the gap between someone who can read that data with nuance and someone who just runs reports has never been wider.
My friend, the content writer from the start of this story? She shifted her focus to CI-type keywords in her niche — specifically comparison and “for [specific persona]” style queries — and within four months her affiliate revenue tripled while her overall traffic actually dropped slightly. Less volume, better fit, dramatically better results.
Editor’s note: Keyword research isn’t a one-time task you check off a list — it’s an ongoing conversation with your audience’s evolving language. The 2025 shift toward intent-based, AI-aware strategy isn’t a reason to panic; it’s a reason to get more precise. And precision, it turns out, tends to pay better than volume anyway.